Which Countries Apply for the Most Trademarks Around the World?
What was the first trademark? The earliest known depictions of “trademarks” are found in Stone Age cave paintings; livestock is shown with branding intended to identify personal property. Ancient Egyptian masonry shows marks and stonecutters’ signs, which identify the stone’s source and the laborer who built with it. Trade guilds in the Middle Ages had distinctive graphic designs to distinguish their work. In fact, some of those marks are still in use today, even if the guilds who created them no longer exist. As with many facets of society, rules and regulations were eventually imposed on this marking system. The first trademark legislation was the Bakers’ Marking Law enacted by the British Parliament in 1266, which required every baker to mark the bread they made. As time went on, global trademark registration became more rigorous to protect the livelihoods of creators in a profit-driven world.
There are now trademark registration costs, international trademark registration requirements, and differing sets of international trademark laws. Trademark registration by country varies, but fortunately, there are simple solutions, which we will explore below. But what country registers the most trademarks per year? The team at Nominus.com did a deep dive into the World Intellectual Property Organization’s statistics database to find where the most trademarks are registered around the globe, which can provide intriguing insights into the innovative spirit of international cultures.

What Is a Trademark?
According to the United States Patent and Trademark Office, a trademark “can be any word, phrase, symbol, design, or a combination of these things that identifies your goods or services.” Why do you need a trademark? A trademark is essential because it identifies the origin of your products or services, offers legal protection for your brand, and helps prevent fraud and counterfeiting.
Is Registering and Trademarking the Same Thing?
Not quite. You own your trademark as soon as you start using it to distinguish your goods or services. You do establish some rights by using your trademark, but they are limited and are only valid in the geographic area where you provide your product. To obtain stronger, country-wide rights, you need to apply to register your trademark. Although this is not a requirement, a registered trademark is more protected and versatile. For example, you may use your logo as a trademark for handmade pottery you sell at a local artisans’ market, but if you wish to expand and take your business online, officially registering your trademark can fortify your rights nationwide.
Do Trademarks Apply to Other Countries?
No! A U.S. trademark registration will not provide protection for your trademark in other countries. Trademarks are territorial and need to be filed for each country you are seeking protection in. Sounds tedious, right? Fortunately, if you are a qualified owner of a trademark application pending in the United States with the U.S. Patent and Trademark Office, or if your trademark is already officially registered, you can seek registrations in any countries belonging to the Madrid Protocol by filing an international trademark application with the International Bureau of the World Property Intellectual Organization.
What Is the Madrid Protocol?
The Madrid Protocol, or Madrid system, is the primary international system for managing the registration of trademarks in jurisdictions worldwide. It is a convenient and cost-effective way to apply for, manage, and pay for protection in up to 128 countries. The team at Nominus.com can help you register your trademark internationally. Check out our resources for international trademark registration here.
Which Country Has the Most Trademark Applications in the World?
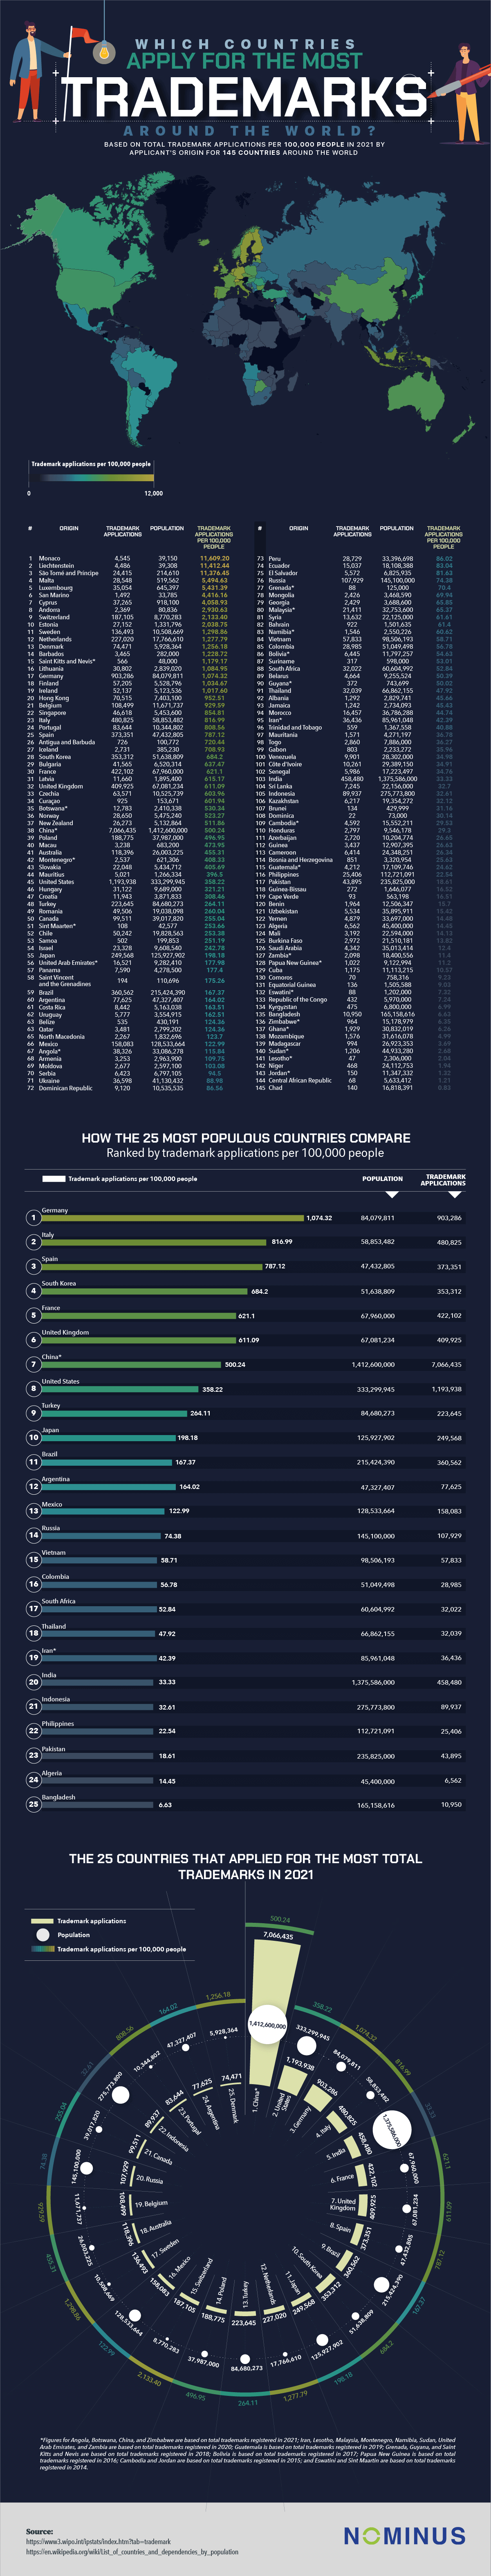
Now that we have explored what a trademark means, let’s take a look at which countries apply for the most trademarks in the world. We analyzed the total trademark applications in 2021 in 145 countries around the world, adjusting for population. Here are the top 20 countries with the most trademark applications per 100,000 people:
| 1 |
Monaco |
11,609.20
|
| 2 |
Liechtenstein |
11,412.44 |
| 3 |
São Tomé and Príncipe |
11,376.45 |
| 4 |
Malta |
5,494.63 |
| 5 |
Luxembourg |
5,431.39 |
| 6 |
San Marino |
4,416.16 |
| 7 |
Cyprus |
4,058.93 |
| 8 |
Andorra |
2,930.63 |
| 9 |
Switzerland |
2,133.40 |
| 10 |
Estonia |
2,038.75 |
| 11 |
Sweden |
1,298.86 |
| 12 |
Netherlands |
1,277.79 |
| 13 |
Denmark |
1,256.18 |
| 14 |
Barbados |
1,228.72 |
| 15 |
Saint Kitts and Nevis |
1,179.17 |
| 16 |
Lithuania |
1,084.95 |
| 17 |
Germany |
1,074.32 |
| 18 |
Finland |
1,034.67 |
| 19 |
Ireland |
1,017.60 |
| 20 |
Hong Kong |
952.51 |
Which Countries Apply for the Most Trademarks per Capita Around the World?
| Rank |
Country |
Trademark Applications |
Population |
Trademark Applications per 100,000 People |
| 1 |
Monaco |
4,545 |
39,150 |
11,609.20 |
| 2 |
Liechtenstein |
4,486 |
39,308 |
11,412.44 |
| 3 |
São Tomé and Príncipe |
24,415 |
214,616 |
11,376.45 |
| 4 |
Malta |
28,548 |
519,562 |
5,494.63 |
| 5 |
Luxembourg |
35,054 |
645,397 |
5,431.39 |
| 6 |
San Marino |
1,492 |
33,785 |
4,416.16 |
| 7 |
Cyprus |
37,265 |
918,100 |
4,058.93 |
| 8 |
Andorra |
2,369 |
80,836 |
2,930.63 |
| 9 |
Switzerland |
187,105 |
8,770,283 |
2,133.40 |
| 10 |
Estonia |
27,152 |
1,331,796 |
2,038.75 |
| 11 |
Sweden |
136,493 |
10,508,669 |
1,298.86 |
| 12 |
Netherlands |
227,020 |
17,766,610 |
1,277.79 |
| 13 |
Denmark |
74,471 |
5,928,364 |
1,256.18 |
| 14 |
Barbados |
3,465 |
282,000 |
1,228.72 |
| 15 |
Saint Kitts and Nevis* |
566 |
48,000 |
1,179.17 |
| 16 |
Lithuania |
30,802 |
2,839,020 |
1,084.95 |
| 17 |
Germany |
900,286 |
84,079,811 |
1,074.32 |
| 18 |
Finland |
57,205 |
5,528,796 |
1,034.67 |
| 19 |
Ireland |
52,137 |
5,123,536 |
1,017.60 |
| 20 |
Hong Kong |
70,515 |
7,403,100 |
952.51 |
| 21 |
Belgium |
108,499 |
11,671,737 |
929.59 |
| 22 |
Singapore |
46,618 |
5,453,600 |
854.81 |
| 23 |
Italy |
480,825 |
58,853,482 |
816.99 |
| 24 |
Portugal |
83,644 |
10,344,802 |
808.56 |
| 25 |
Spain |
373,351 |
47,432,805 |
787.12 |
| 26 |
Antigua and Barbuda |
726 |
100,772 |
720.44 |
| 27 |
Iceland |
2,731 |
385,230 |
708.93 |
| 28 |
South Korea |
353,312 |
51,638,809 |
684.20 |
| 29 |
Bulgaria |
41,565 |
6,520,314 |
637.47 |
| 30 |
France |
422,102 |
67,960,000 |
621.10 |
| 31 |
Latvia |
11,660 |
1,895,400 |
615.17 |
| 32 |
United Kingdom |
409,925 |
67,081,234 |
611.09 |
| 33 |
Czechia |
63,571 |
10,525,739 |
603.96 |
| 34 |
Curaçao |
925 |
153,671 |
601.94 |
| 35 |
Botswana* |
17,783 |
2,410,338 |
530.34 |
| 36 |
Norway |
28,650 |
5,475,240 |
523.27 |
| 37 |
New Zealand |
26,273 |
5,132,864 |
511.86 |
| 38 |
China* |
7,066,435 |
1,412,600,000 |
500.24 |
| 39 |
Poland |
188,775 |
37,987,000 |
496.95 |
| 40 |
Macau |
3,238 |
683,200 |
473.95 |
| 41 |
Australia |
118,936 |
26,003,225 |
455.31 |
| 42 |
Montenegro* |
2,537 |
621,306 |
408.33 |
| 43 |
Slovakia |
22,048 |
5,434,712 |
405.69 |
| 44 |
Mauritius |
5,021 |
1,266,334 |
396.50 |
| 45 |
United States |
1,193,938 |
333,299,945 |
358.22 |
| 46 |
Hungary |
31,122 |
9,689,000 |
321.21 |
| 47 |
Croatia |
11,943 |
3,871,833 |
308.46 |
| 48 |
Turkey |
223,645 |
84,680,273 |
264.11 |
| 49 |
Romania |
49,506 |
19,038,098 |
260.04 |
| 50 |
Canada |
99,511 |
39,017,820 |
255.04 |
| 51 |
Saint Maarten* |
108 |
42,577 |
253.66 |
| 52 |
Chile |
50,242 |
19,828,563 |
253.38 |
| 53 |
Samoa |
502 |
199,853 |
251.19 |
| 54 |
Israel |
23,328 |
9,608,540 |
242.78 |
| 55 |
Japan |
249,568 |
125,927,902 |
198.18 |
| 56 |
United Arab Emirates* |
16,521 |
9,282,410 |
177.98 |
| 57 |
Panama |
7,590 |
4,278,500 |
177.40 |
| 58 |
Saint Vincent and the Grenadines |
194 |
110,696 |
175.26 |
| 59 |
Brazil |
360,562 |
215,424,390 |
167.37 |
| 60 |
Argentina |
77,625 |
47,327,407 |
164.02 |
| 61 |
Costa Rica |
8,442 |
5,163,038 |
163.51 |
| 62 |
Uruguay |
5,777 |
3,554,915 |
162.51 |
| 63 |
Belize |
535 |
430,191 |
124.36 |
| 64 |
Qatar |
3,481 |
2,799,202 |
124.36 |
| 65 |
North Macedonia |
2,267 |
1,832,696 |
123.70 |
| 66 |
Mexico |
158,083 |
128,533,664 |
122.99 |
| 67 |
Angola* |
38,326 |
33,086,278 |
115.84 |
| 68 |
Armenia |
3,253 |
2,963,900 |
109.75 |
| 69 |
Moldova |
2,677 |
2,597,100 |
103.08 |
| 70 |
Serbia |
6,423 |
6,797,105 |
94.50 |
| 71 |
Ukraine |
36,598 |
41,130,432 |
88.98 |
| 72 |
Dominican Republic |
9,120 |
10,535,535 |
86.56 |
| 73 |
Peru |
28,729 |
33,396,698 |
86.02 |
| 74 |
Ecuador |
15,037 |
18,108,388 |
83.04 |
| 75 |
El Salvador |
5,572 |
6,825,935 |
81.63 |
| 76 |
Russia |
107,929 |
145,100,000 |
74.38 |
| 77 |
Grenada* |
88 |
125,000 |
70.40 |
| 78 |
Mongolia |
2,426 |
3,468,590 |
69.94 |
| 79 |
Georgia |
2,429 |
3,688,600 |
65.85 |
| 80 |
Malaysia* |
21,411 |
32,753,600 |
65.37 |
| 81 |
Syria |
13,632 |
22,125,000 |
61.61 |
| 82 |
Bahrain |
922 |
1,501,635 |
61.40 |
| 83 |
Namibia* |
1,546 |
2,550,226 |
60.62 |
| 84 |
Viet Nam |
57,833 |
98,506,193 |
58.71 |
| 85 |
Colombia |
28,985 |
51,049,498 |
56.78 |
| 86 |
Bolivia* |
6,445 |
11,797,257 |
54.63 |
| 87 |
Suriname |
317 |
598,000 |
53.01 |
| 88 |
South Africa |
32,022 |
60,604,992 |
52.84 |
| 89 |
Belarus |
4,664 |
9,255,524 |
50.39 |
| 90 |
Guyana* |
372 |
743,699 |
50.02 |
| 91 |
Thailand |
32,039 |
66,862,155 |
47.92 |
| 92 |
Albania |
1,292 |
2,829,741 |
45.66 |
| 93 |
Jamaica |
1,242 |
2,734,093 |
45.43 |
| 94 |
Morocco |
16,457 |
36,786,288 |
44.74 |
| 95 |
Iran* |
36,436 |
85,961,048 |
42.39 |
| 96 |
Trinidad y Tobago |
559 |
1,367,558 |
40.88 |
| 97 |
Mauritania |
1,571 |
4,271,197 |
36.78 |
| 98 |
Togo |
2,860 |
7,886,000 |
36.27 |
| 99 |
Gabon |
803 |
2,233,272 |
35.96 |
| 100 |
Venezuela |
9,901 |
28,302,000 |
34.98 |
| 101 |
Côte d'Ivoire |
10,261 |
29,389,150 |
34.91 |
| 102 |
Senegal |
5,986 |
17,223,497 |
34.76 |
| 103 |
India |
458,480 |
1,375,586,000 |
33.33 |
| 104 |
Sri Lanka |
7,245 |
22,156,000 |
32.70 |
| 105 |
Indonesia |
89,937 |
275,773,800 |
32.61 |
| 106 |
Kazakhstan |
6,217 |
19,354,272 |
32.12 |
| 107 |
Brunei |
134 |
429,999 |
31.16 |
| 108 |
Dominica |
22 |
73,000 |
30.14 |
| 109 |
Cambodia* |
4,592 |
15,552,211 |
29.53 |
| 110 |
Honduras |
2,797 |
9,546,178 |
29.30 |
| 111 |
Azerbaijan |
2,720 |
10,204,774 |
26.65 |
| 112 |
Guinea |
3,437 |
12,907,395 |
26.63 |
| 113 |
Cameroon |
6,414 |
24,348,251 |
26.34 |
| 114 |
Bosnia and Herzegovina |
851 |
3,320,954 |
25.63 |
| 115 |
Guatemala* |
4,212 |
17,109,746 |
24.62 |
| 116 |
Philippines |
25,406 |
112,721,091 |
22.54 |
| 117 |
Pakistan |
43,895 |
235,825,000 |
18.61 |
| 118 |
Guinea-Bissau |
272 |
1,646,077 |
16.52 |
| 119 |
Cape Verde |
93 |
563,198 |
16.51 |
| 120 |
Benin |
1,964 |
12,506,347 |
15.70 |
| 121 |
Uzbekistan |
5,534 |
35,895,911 |
15.42 |
| 122 |
Yemen |
4,879 |
33,697,000 |
14.48 |
| 123 |
Algeria |
6,562 |
45,400,000 |
14.45 |
| 124 |
Mali |
3,192 |
22,594,000 |
14.13 |
| 125 |
Burkina Faso |
2,972 |
21,510,181 |
13.82 |
| 126 |
Saudi Arabia |
4,342 |
35,013,414 |
12.40 |
| 127 |
Zambia |
2,098 |
18,400,556 |
11.40 |
| 128 |
Papua New Guinea* |
1022 |
9,122,994 |
11.20 |
| 129 |
Cuba |
1,175 |
11,113,215 |
10.57 |
| 130 |
Comoros |
70 |
758,316 |
9.23 |
| 131 |
Equatorial Guinea |
136 |
1,505,588 |
9.03 |
| 132 |
Eswatini* |
88 |
1,202,000 |
7.32 |
| 133 |
Republic of the Congo |
432 |
5,970,000 |
7.24 |
| 134 |
Kyrgyzstan |
475 |
6,800,000 |
6.99 |
| 135 |
Bangladesh |
10,950 |
165,158,616 |
6.63 |
| 136 |
Zimbabwe* |
964 |
15,178,979 |
6.35 |
| 137 |
Ghana* |
1,929 |
30,832,019 |
6.26 |
| 138 |
Mozambique |
1,576 |
31,616,078 |
4.99 |
| 139 |
Madagascar |
994 |
26,923,353 |
3.69 |
| 140 |
Sudan* |
1,206 |
44,933,280 |
2.68 |
| 141 |
Lesotho* |
47 |
2,306,000 |
2.04 |
| 142 |
Niger |
468 |
24,112,753 |
1.94 |
| 143 |
Jordan |
150 |
11,347,332 |
1.32 |
| 144 |
Central African Republic |
68 |
5,633,412 |
1.21 |
| 145 |
Chad |
140 |
16,818,391 |
0.83 |
How the 25 Most Populous Countries Compare
| Rank |
Country |
Trademark Applications |
Population |
Trademark Applications per 100,000 People |
| 1 |
Germany |
903,286 |
84,079,811 |
1,074.32 |
| 2 |
Italy |
480,825 |
58,853,482 |
816.99 |
| 3 |
Spain |
373,351 |
47,432,805 |
787.12 |
| 4 |
South Korea |
353,312 |
51,638,809 |
684.20 |
| 5 |
France |
422,102 |
67,960,000 |
621.10 |
| 6 |
United Kingdom |
409,925 |
67,081,234 |
611.09 |
| 7 |
China* |
7,066,435 |
1,412,600,000 |
500.24 |
| 8 |
United States |
1,193,938 |
333,299,945 |
358.22 |
| 9 |
Turkey |
223,645 |
84,680,273 |
264.11 |
| 10 |
Japan |
249,568 |
125,927,902 |
198.18 |
| 11 |
Brazil |
360,562 |
215,424,390 |
167.37 |
| 12 |
Argentina |
77,625 |
47,327,407 |
164.02 |
| 13 |
Mexico |
158,083 |
128,533,664 |
122.99 |
| 14 |
Russia |
107,929 |
145,100,000 |
74.38 |
| 15 |
Viet Nam |
57,833 |
98,506,193 |
58.71 |
| 16 |
Colombia |
28,985 |
51,049,498 |
56.78 |
| 17 |
South Africa |
32,022 |
60,604,992 |
52.84 |
| 18 |
Thailand |
32,039 |
66,862,155 |
47.92 |
| 19 |
Iran* |
36,436 |
85,961,048 |
42.39 |
| 20 |
India |
458,480 |
1,375,586,000 |
33.33 |
| 21 |
Indonesia |
89,937 |
275,773,800 |
32.61 |
| 22 |
Philippines |
25,406 |
112,721,091 |
22.54 |
| 23 |
Pakistan |
43,895 |
235,825,000 |
18.61 |
| 24 |
Algeria |
6,562 |
45,400,000 |
14.45 |
| 25 |
Bangladesh |
10,950 |
165,158,616 |
6.63 |
The 25 Countries That Applied for the Most Trademarks in 2021
| Rank |
Country |
Trademark Applications |
Population |
Trademark Applications per 100,000 People |
| 1 |
China* |
7,066,435 |
1,412,600,000 |
500.24 |
| 2 |
United States |
1,193,938 |
333,299,945 |
258.22 |
| 3 |
Germany |
903,286 |
84,079,811 |
1,074.32 |
| 4 |
Italy |
480,825 |
58,853,482 |
816.99 |
| 5 |
India |
458,480 |
1,375,586,000 |
33.33 |
| 6 |
France |
422,102 |
67,960,000 |
621.10 |
| 7 |
United Kingdom |
409,925 |
67,081,234 |
611.09 |
| 8 |
Spain |
373,351 |
47,432,805 |
787.12 |
| 9 |
Brazil |
360,562 |
215,424,390 |
167.37 |
| 10 |
South Korea |
353,312 |
51,638,809 |
684.20 |
| 11 |
Japan |
249,568 |
125,927,902 |
198.18 |
| 12 |
Netherlands |
227,020 |
17,766,610 |
1,277.79 |
| 13 |
Turkey |
223,645 |
84,680,273 |
264.11 |
| 14 |
Poland |
188,775 |
37,987,000 |
496.95 |
| 15 |
Switzerland |
187,105 |
8,770,283 |
2,133.40 |
| 16 |
Mexico |
158,083 |
128,533,664 |
122.99 |
| 17 |
Sweden |
136,493 |
10,508,669 |
1,298.86 |
| 18 |
Australia |
118,396 |
26,003,225 |
455.31 |
| 19 |
Belgium |
108,499 |
11,671,737 |
929.59 |
| 20 |
Russia |
107,929 |
145,100,000 |
74.38 |
| 21 |
Canada |
99,511 |
39,017,820 |
255.04 |
| 22 |
Indonesia |
89,937 |
275,773,800 |
32.61 |
| 23 |
Portugal |
83,644 |
10,344,802 |
808.56 |
| 24 |
Argentina |
77,625 |
47,327,407 |
164.02 |
| 25 |
Denmark |
74,471 |
5,928,364 |
1,256.08 |
*Figures for Angola, Botswana, China, and Zimbabwe are based on total trademarks registered in 2021; Iran, Lesotho, Malaysia, Montenegro, Namibia, Sudan, United Arab Emirates, and Zambia are based on total trademarks registered in 2020; Guatemala is based on total trademarks registered in 2019; Grenada, Guyana, and Saint Kitts and Nevis are based on total trademarks registered in 2018; Bolivia is based on total trademarks registered in 2017; Papua New Guinea is based on total trademarks registered in 2016; Cambodia and Jordan are based on total trademarks registered in 2015; and Eswatini and Sint Maartin are based on total trademarks registered in 2014.